Ischemia Injury Infarction EKG Module
Ischemia, Injury & Infarction
Tech Series
ECG Interpretation
Thomas E. O'Brien
AS CCT CRAT RMA
Learning Objectives
Upon completion of the accompanying narrative and practice the student will be able to:
- Associate the views of a 12-Lead ECG with specific surfaces and the primary artery to that region of the heart
- Know the difference between indicative and reciprocal views
- Measure and recognize electrocardiographic changes caused by STEMI (EKG changes MI)
- ischemia
- injury
- infarction
12-Lead ECG
- People may choose to analyze ECG’s in a number of different ways. The sequence doesn’t necessarily matter as long as you gather and report the proper information each time. I read from left to right as much as possible (in anatomic groupings).
- If your protocols are different, always follow them.
- The following slides will review the leads, surfaces, and associated coronary arteries which commonly supply that portion of the heart.
Please sign in. This module is premium content.
Lessons
Lesson #1: Views 323
Illustration
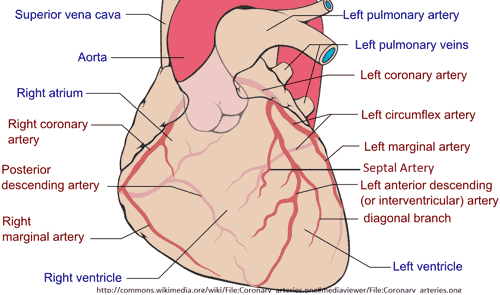
This file is licensed under the Creative Commons Attribution-Share Alike 3.0
Author: Patrick J. Lynch, medical illustrator
II, III & aVF
- Inferior wall of left ventricle
- Right Coronary Artery
- Marginal branch
V1 & V2
- Septum
- Left Coronary
- Septal branch
V3 & V4
- Anterior
- Left Coronary
- Anterior Descending and Diagonal arteries
I, aVL, V5 & V6
- Lateral
- Left Coronary
- Circumflex & Obtuse marginal
Labeled Views
Lesson #2: Quick Check 1 323
Question 1
Name the inferior view leads.
Answer
II, III & aVF
Question 2
Name the main coronary artery that supplies this artery.
Answer
Right Main Coronary artery
Lesson #3: Quick Check 2 323
Question 1
Name the septal view leads.
Answer
V1 & V2
Question 2
Name the artery that supplies the septal wall.
Answer
Left Main Coronary artery
Lesson #4: Quick Check 3 323
Question 1
Name the anterior view leads.
Answer
V3 & V4
Question 2
Name the arteries that supply the anterior wall.
Answer
Anterior Descending and Diagonal artery
Question 3
Name the main coronary artery that supplies this artery.
Answer
Left Main Coronary artery
Lesson #5: Quick Check 4 323
Question 1
Name the lateral view leads.
Answer
I, aVL, V5 & V6
Question 2
Name the arteries that supply the lateral wall.
Answer
Circumflex and Obtuse Marginal
Question 3
Name the main coronary artery that supplies this artery.
Answer
Left Main Coronary artery
Lesson #6: Indicative vs Reciprocal
Views of the heart
Views seen on a 12-Lead EKG that look directly at a surface of the heart are referred to as “indicative leads” i.e. the views provided on a standard (left side of the chest) ECG like II, III, aVF – inferior etc.
If additional views are required to view the right ventricle or posterior of the heart directly, the chest leads would actually have to be physically moved to either the right side or posterior wall of the chest.
This is not always practical or prudent in the emergency setting…so, many providers initially rely upon indirect (reciprocal) views.
Continued
Views of the heart that or indirect are often referred to as “mirror-image” or “reverse” or “reciprocal” views.
In this instance morphologic changes that we would typically expect to see would be the reverse or opposite change. Meaning, what we would expect to see elevated would be depressed and changes reflected in depression would be elevated.
What is up would be down and down would be up!
Lesson #7: Ischemia, Injury Infarction
Part 1
Think of the process of ischemia, injury and infarction as a worsening continuum.
If immediate, aggressive and effective care is not provided, ischemia will worsen (or progress) to injury and ultimately infarction (tissue death)
Ischemia, injury and infarction each impact the cardiac complex in unique ways.
Part 2
12-Lead Analysis requires we follow these steps of analysis.
- ST segment for presence of deviation
- T wave morphology changes
- Q wave morphology changes
Part 3
The changes I have been referring to must occur in anatomically contiguous leads. This refers to 2 or more leads “looking” at (viewing) the same part of the heart or numerically consecutive chest leads
Examples Include:
- II, III, aVF (2 of the 3 leads must show changes. It does not have to be all three)
- I, aVL can show changes and not effect V5 and V6 to still be clinically significant
- Numerically consecutive chest leads
We always recall that V1 is next to V2, but do not forget that V2 is also contiguous with (next to) V3…if V2 & V3 are showing changes, this is clinically significant too. See the next slide for an illustration.
Lesson #8: Numerically Consecutive Contiguous Leads
Illustration
Lesson #9: Ischemia
Introduction
Ischemia causes a delay in repolarization and causes specific changes to either or both the ST segment and T wave.
Ischemia is evidenced when ST segment depression of 1 mm or more or T wave inversion is seen in two or more anatomically contiguous leads
ST Segment Depression
T Wave Inversion
Lesson #10: Injury
Introduction
Ischemia delayed for even a few minutes can progress (worsen) to myocardial injury.
Injury is evidenced when ST segment elevation of 1 mm or more is seen in two or more anatomically contiguous leads
EKG
Injury Examples.
Note: ST Elevation in both examples
Lesson #11: Infarction
Introduction
A normal (physiologic) “Q” wave measures less than 0.04 second
Depth measures less than 1/3 height of R wave
EKG
An abnormal (pathologic) “Q” wave measures 0.04 (small box) second or greater in duration, and/or the depth measures greater than or equal to 1/3 height of R wave
Once an MI is completed, the ST segment will return to the baseline and the T wave will return to its normal orientation, but “Q” waves are often the one remaining change to a cardiac complex as evidence that tissue necrosis or tissue death (infarction) has occurred.
Lesson #12: Quick Check 5 323
Question
What is the term used that refers to direct changes seen on a 12-Lead ECG?
Answer
Indicative changes
Question
What is the term used that refers to reverse or indirect changes seen on a 12-Lead ECG because the ECG is looking at that surface of the heart indirectly?
Answer
Reciprocal
Lesson #13: AMI Location Practice 1
ECG
Identify the location of the AMI on this 12-Lead ECG
Location
ST elevation in Inferior Leads II, III and aVF
ECG
Identify the location of the AMI on this 12-Lead ECG
Location
Pathologic Q wave noted in Inferior Leads II, III, aVF
Lesson #14: AMI Location Practice 2
ECG
Identify the location of the AMI on this 12-Lead ECG
Location
Pathologic Q wave noted in Leads III and aVF
ECG
Identify the location of the AMI on this 12-Lead ECG
Location
Note ST depression and T wave inversion in V1 - V6
Lesson #15: AMI Location Practice 3
ECG
Identify the location of the AMI on this 12-Lead ECG
Location
ST depression is observed in leads V2, V3, V4, V5, V6 and Lead I
ECG
Identify the location of the AMI on this 12-Lead ECG
Location
ST elevation noted in leads V4, V5, V6, I and aVL. Lateral wall
Lesson #16: AMI Location Practice 4
ECG
Identify the location of the AMI on this 12-Lead ECG
Location
ST elevation noted in Inferior leads II, III and aVF
ECG
Identify the location of the AMI on this 12-Lead ECG
Location
ST elevation noted in Inferior and Anterior leads II, III, aVF and V3, V4
Lesson #17: AMI Location Practice 5
ECG
Identify the location of the AMI on this 12-Lead ECG
Location
ST elevation noted in Inferior leads II, III and aVF. Reciprocal (mirror image) ST depression noted in V1, V2, V3 and V4. Possible inferoposterior wall AMI
ECG
Identify the location of the AMI on this 12-Lead ECG
Location
Note ST elevation in Inferior leads II, III and aVF
Lesson #18: AMI Location Practice 6
ECG
Identify the location of the AMI on this 12-Lead ECG
Location
ST elevation noted in Anterior, Lateral and Septal leads V2, V3, V4, V5 and Lead I
ECG
Identify the location of the AMI on this 12-Lead ECG
Location
Anterior Lateral and Septal ST elevation in Leads V1, V2, V3, V4, V5 and Lead I (aVL is questionable)
Lesson #19: AMI Location Practice 7
ECG
Identify the location of the AMI on this 12-Lead ECG
Location
Note ST elevation in Leads V2, V3, V4, V5 and V6. Anterolateral AMI with Septal extension
ECG
Identify the location of the AMI on this 12-Lead ECG
Location
ST segment Elevation noted in Septal, Anterior and Lateral Leads V1, V2, V3, V4, V5 and I
Lesson #20: AMI Location Practice 8
ECG
Identify the location of the AMI on this 12-Lead ECG
Location
Lateral ST elevation noted in leads V2, V3, V4, V5, V6, I and aVL
ECG
Identify the location of the AMI on this 12-Lead ECG
Location
ST depression noted in Anterior and Lateral leads V3, V4, V5, V6, I. ST depression is also noted in leads II, III and aVF
Authors and Reviewers
- EKG heart rhythm modules: Thomas O'Brien
-
Medical review: Dr. Jonathan Keroes, MD
- Medical review: Dr. Pedro Azevedo, MD, Cardiology
-
Last Update: 11/8/2021
Sources
-
Electrocardiography for Healthcare Professionals, 6th Edition
Kathryn Booth and Thomas O'Brien
ISBN10: 1265013470, ISBN13: 9781265013479
McGraw Hill, 2023 -
Rapid Interpretation of EKG's, Sixth Edition
Dale Dublin
Cover Publishing Company -
EKG Reference Guide
EKG.Academy -
12 Lead EKG for Nurses: Simple Steps to Interpret Rhythms, Arrhythmias, Blocks, Hypertrophy, Infarcts, & Cardiac Drugs
Aaron Reed
Create Space Independent Publishing -
The Virtual Cardiac Patient: A Multimedia Guide to Heart Sounds, Murmurs, EKG
Jonathan Keroes, David Lieberman
Publisher: Lippincott Williams & Wilkin)
ISBN-10: 0781784425; ISBN-13: 978-0781784429 -
ECG Reference Guide
PracticalClinicalSkills.com